Chronosequence:
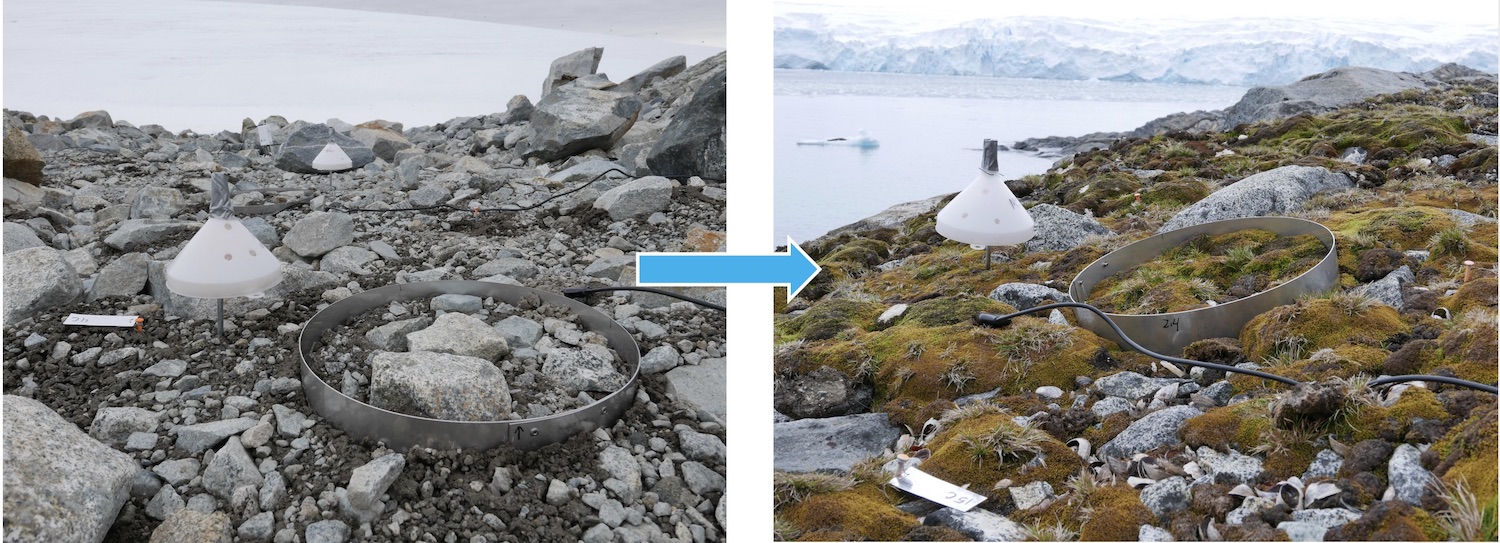
We implemented a warming experiment (using open-top chambers) along a chronosequence. A chronosequence is essentially a series of sites that have certain things in common, such as climate, parent material (e.g. in our case it is the glacial till that was underneath the glacier), etc., but they vary in age. We use a chronosequence as a way to understand how vegetation and communities develop. For example, close to the glacier we have a site with no plants at all (because the soils there were only very recently exposed) and more vegetation nearer to Palmer Station (because these have been ice-free since the 1960s). Because climate is similar and the geologic material also, we can predict that the sites near the glacier to become more similar to the site close to the station (in terms of plant and soil microbial communities).

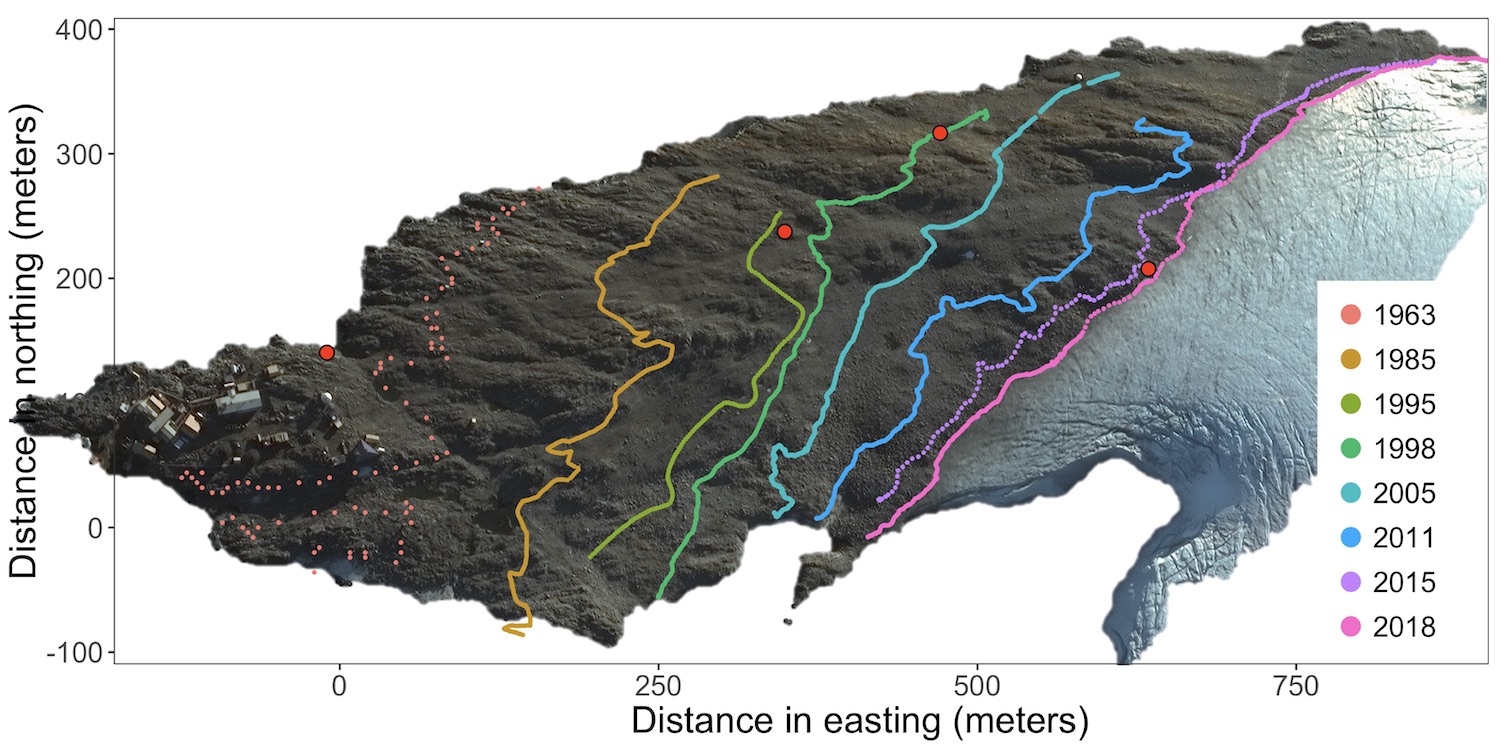
Where exactly on the chronosequence are our sites located? See the graph I created below. The different colors represent where the glacier edge was in different years!! The lines consist of individual points, and in 1963 close to the station (on the left side of the image), the GPS coordinates were measured far more sporadically than all the other years (hence, more dotted). But aside from that: calculations show that the glacier recedes about 10 meters per year!!
Unfortunately, nearly 90% of glaciers on the western Antarctic Peninsula are receding, and similar rates of recession have been reported elsewhere ….
From the graph you can see that our sites (large bright red dots) are about 1 year, 20 years and 60 years in age. The one on Litchfield island (not shown) is likely about 1,000 years old. For us, this is a nice chronosequence to study how additional warming (with our chambers) may affect plant and microbial communities along the chronosequence.

(Sattelite image is copyrighted 2018 DigitalGlobe, Inc.; GPS coordinates were provided by Palmer Station staff, including Marissa Goerke).